Wednesday, December 27, 2017
Tuesday, December 26, 2017
EL10_T4

________________________________________________________________
Synonym
1) Charge for: pay for, acquire, purchase
2) Free: without charge, complimentary
3) Admission: entering, allowing entry,entrance, acceptance, access, admittance
_________________________________________________________________
Essay Planing
Question for analysis:
1) Is it much to pay for entry the museum? Does it too expensive?
2) does museum is valuable to charge?
3) how it important to charge and where money go?
4) is it expensive to pay for entry ?
5) is it normal that museum are free for entry?
6) What happen if it is free for entry every museum and make payment as one option?
7) Do you think the money that is spent is a better use?
_________________________________________________________________
Introduction
Sentence
1- Paraphrase question
Sentence
2- Thesis statement (state which one outweighs the other)
Main
Body Paragraph 1 (Stronger Side)
The payment for accessing museum is much more benefit due to it contributes to economic development and make the it live longer for young generation.
Main
Body Paragraph 2 (Weaker Side)
Sentence
10- Without charge of admission of museum give more opportunity for poor people lining in remote area to visit museum located in a city.
Conclusion
Sentence
13- The advantage of payment for accessing a museum is much more than advantage due to budged from this resource can be used for museum conservation.
_________________________________________________________________
_________________________________________________________________
EL10_T3

_______________________________________________________________
country: nation, community, region, society
similar: very much alike, comparable, identical
product: brand, produce
world: planet, globe, nature
anywhere: unspecified area, anyplace
_____________________________________________________________
Essay plan
Introduction
S1: paraphrase
In recent year, nations in the world have become the same structure due to people are about to purchase products anyplace.
Thesis statement(only the side you stand for):
I do believe that such development way is positive development tendency due to it is more beautiful and comfortable for a human.
Body
S1:
Many people buy quality and beauty product to build a house and construct infrastructures in their community.
S2: People are more comfortable due to they utilize beautiful products and make the better life with the standard product made from foreign countries.
Conclusion
In summary, I believe that the similarity of country development in the world is much more important for people.
_________________________________________________________________
Essay


Sunday, December 24, 2017
IELTS10_T4 Writing

_________________________________________________________________
- Synonym1) Life cycle: process of lifeform, biological clock
2) Species: variety, class
3) Large: great
______________________________________________________________
Writing:
Writing EL10_T3
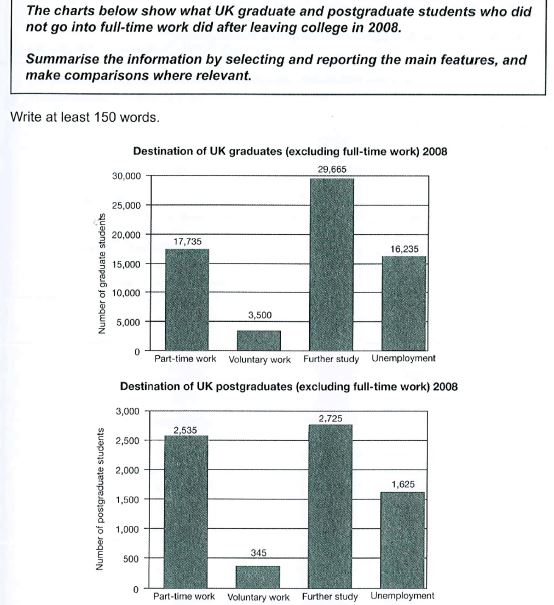
The bar charts illustrate the number of graduate and post graduate students of British did not work as a full-time staff when they graduated from college in 2018. There were four main reasons that British students had including part-time work, voluntary work, further study and unemployment. Overall, most of graduate and post graduate students continued their study while there were not many students work as voluntary. Both graduate and post graduate students had the same idea when they graduated from university.
At least 29,665 graduated students in the British targeted on study future. It is the considerable highest students comparing to other four options that were chosen by students including part time work (17,735 student), employment (16,235 students), and voluntary work (3,500 students).
In terms of post graduate students, post-graduate students choose study further the most. It was accounted for 2,725 students. The number of students (2,535) who chose part-time work were slightly less than post-graduate students who study further. 1,625 students were unemployment which were higher than volunteer work (345 students).
Model of writing answer Task 1 band 9
source(http://ieltsliz.com/ielts-line-graph-and-bar-chart-model-answer-band-9/)

click for the answer model

click for the answer model
Saturday, December 23, 2017
ILTS Listening
IELTS 10 T1_1
IELTS 10 T1_2
IELTS 10 T1_3
IELTS 10 T1_4
IELTS 10 T1_5
IELTS 10 T1_6
IELTS 10 T1_7
IELTS 10 T1_8
Friday, December 22, 2017
Writing test P02

Overall, most of British students spoke none other language (English only) in a university in England. In addition, other language was spoken by the students significantly increased while France speaking and Spanish only decreased in 2010.
In 2000, no other language speaking (English only) showed highest percentage with 30%. One five of the British students spoke French only which is the same of other language group. Two languages and German speaking were recorded the same figure at 10%.
Within a decade, the figure of students who speak other language was changed. Other language spoken by the British students was increased to 20% in 2010. This figure showed the higher proportion than French only (10%), German (10%), Spanish only(20%) and two other languages(10%). In addition, the percentage of French speaking was decreased at 5% from 15% to 10% ( from 2000 to 2010).
Tuesday, December 19, 2017
Bar chart

The girls aged from 45 to 54 were higher than men who had the same age accounted for 52.3% while the men did only 43%. Similarly, there were more women which was 52.5% than men ( 30.5%) aged from 35 to 44. Moreover, in the group of people, females were higher than males at 8% 45.1 for males (45%) and females (53%).
In terms of people in the group age of 15 to 24, the proportion of male was higher than women at around 15% with the percentage of 52.8% and 47.7% respectively. In addition, the percentage of male and female were almost equal at the age of 65 years old to over with the percentage of 46.7% and 67% respectively.
Writing on Pie chart

The first pie chart illustrates the average of energy consumption by households while the second one presents the data of greenhouse gas emitted in Australia. The unit of both pie chart are per cent.
Overall, heating, water heating, other appliances, and refrigerator are the main factors contributing both energy consumption and greenhouse gas emissions. It seems the energy consumption effects to greenhouse gas emission.
Overall, heating, water heating, other appliances, and refrigerator are the main factors contributing both energy consumption and greenhouse gas emissions. It seems the energy consumption effects to greenhouse gas emission.
The first pie chart gives the information of the percentage of household energy use consisting of four elements including heating, water heating, refrigeration, other appliance, lighting and cooling. In this chart, heating shows the higher percentage and following by other appliance, refrigeration, lighting and cooling with the per cent of 42%,30%, 15%, 7%, 4% and 2% respectively.
The second pie chart demonstrates 3 groups of Australia household greenhouse gas emission. The first group is the relative large amount of greenhouse gas emission including water heating (32%) and other appliances (28%) while the medium scale of greenhouse gas emission are heating (15%) and refrigeration (14%). In addition, the smallest group of greenhouse gas emission are lighting and cooling with the percentage of 8% and 3% respectively.
It seems two factor has relation in both pie chart given for example water heating and cooling due to they have similar data.
Writing task 1

In term of coffee production, it was the Switzerland selling coffee the most in 1999, it was 3 million euros following by Denmark, 1.8 millions euros and UK, 1.5 million euros but five years later, the British jumped to the first top of coffee sales. It could sell 20 millions euro in 2004 it was almost 14 times compared to the data of sale in 1999. However, Denmark, Belgium and Sweden slightly increased in coffee sale from 1999 to 2004.
Besides,banana production kept the first record of best selling in the Switzerland from 1999 to 2004 and it almost double increased in this duration. However, banana sale was decrease from 2 million euros to 0.9 million euros and was slightly decreased in Sweden from 1.8 to 1 million euros. In Belgium banana sale increased from 0.6 million euros in 1999 to 5.5 million euros in 2002.
Saturday, December 16, 2017
Subscribe to:
Posts (Atom)
-
euthanasia:: the act or practice of killing or permitting the death of hopelessly sick or injured individuals (such as persons or domestic...
-
 The first pie chart illustrates the average of energy consumption by households while the second one presents the data of greenhouse gas ...